

RUT May Produce Exceptional Opportunities Soon.

I feel like there are so many puns I could make about the RUT lagging the other US indices but I set up a username of “HoleyProfit” to deliver a major bear market warning in 2021 (A play on being told many times I had a “God complex” for my 2019 bear forecasts and bear markets) and here I am posting bull stuff.
So I’m out the pun game for now. Let’s talk about the RUT.
In 2021 I posted a bearish forecast on every single RUT stock that was intensely popular. I post all of these with the full extreme of the bear potential. Forecasting most of the popular stocks of the day (Memes, mostly) of at least 75%. When I posted this, I did so thinking this would be the end of a full crash.
When posting this I thought by the time these all hit the world would be on fire. Turns out most of these hit extreme targets while indices had what is (At time of writing) a hiccup in US indices. In hindsight it’s easy to see these having increased ATRs made them more volatile on both ends, which is logical.
So many of the RUT stocks hit major supports. I mean, they got to levels where it’d consider it extremely dauting to be short. I’d be very worried a low may come and even if not things could rally 100% or more (And a stock usually rallies 100% at least 3 times on the way to zero, so overall destination does not matter).
The risk zones now on these are tight. They’ve not only hit their big supports but most of them have also spiked them out. Theoretically, they’ve pinged the price they “Should” bounce and they’ve filled all the tolerance zone for where a spike out would be. For this theory to be true, new lows can’t be made and stops can go there.
Case for RUT Low
The case for the RUT low is awesome. It’s awesome for three reasons:
1 - Probability is quite good. The TA for the RUT has a decent probability long signal and the general mood of indices has been bullish over the last several quarters. Maybe RUT just knows something we’re all due to find out, but if it’s just lagging it puts the wind at the back of TA signals long.
2 - We have very good ways to establish fail points (Stop losses) and these are very close to where we currently area. Relative to where RUT would have to be just to catch up with SPX these are high RR.
3 - It’s viable RUT is setting up a move similar to that of SPX out the 2023 low and if this is the case we can do a very strong roadmap of the move to expect and have a great idea of the spots we want to be more/less aggressive with longs.
Let’s get into the stuff to support this.
We’re going to focus on 3, 1 and 2 are covered by 3. RUT might be setting up an essentially identical version of the SPX low. If this is happening we can reasonably expect to be able to have a great read on a market that provides a lot of opportunity because we’ve already seen the signal work well in SPX.
Where we’d expect to be now would be in the first sell-off forecast here before the big rally began. The 3900 low in SPX.
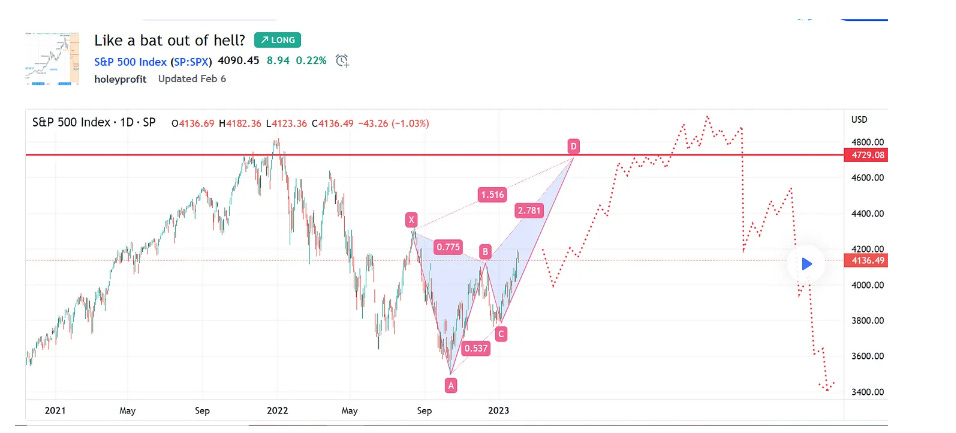
Nothing surprising happened here from the perspective of norms around fibs. The bear fibs broke, the trend was over and once we “W” structure was firmly made we started to hammer up to the fib extension levels. Extremely predictable this happens. Real question is what fib extension does it go to.
This was classic failure of a downtrend. I’ve traded downtrends extensively in the Forex market and 10’s of thousands of times I’ve been in a situation where I was short and the market rallied to break the swing high (Rarely ATH in FX, but swing high is the same thing - trend formation failure). This wasn’t anomalous.
We can extrapolate the same to the RUT and while obviously us deciding that looks good does not mean the RUT has to go up, we really do have a fair chance of being incredibly accurate if it goes up. Let me show you the critical points of the SPX move so we can look at them in RUT now.
Here are posts in which the analysis we’ll be covering were discussed in real time. We’re going to use the stuff we used then. So there’s not fitting here. We’re using stuff that we could use in real time and can be duplicated to RUT in real time if it does the same.
Supportive work and trade plans for a 2007 style market. (substack.com)
A 2007 like move would dictate a low has been made. (substack.com)
TLDR: We’re looking for a W shape at the low to indicate we might be in a bat pattern which will make a new high. If we are, prices should go parabolic.
The “W” structures have different names and different specific rules and it’s really great stuff to learn about but I’m going to keep this at a level where you can understand without knowing the ins and outs of harmonics. I’ll throw in names and stuff for those who know, but I’ll keep it easy to follow.
When a “W” shape can appears, we draw a fib from the high to the low of the last drop. And we’re going to use these levels to make all our major decisions.

Common things on levels:
1.27: This is most often a pullback level. A small retracement comes from this most of the time but it is very rarely a reversal. Any names I have for reversals at 1.27s are four letter words. A reversal from a 1.27 almost always catches me out.

1.61: Massive inflection level. The move is going to end here or take on a whole new legitimacy most of the time. When 1.61 is the reversal level usually you’re in a butterfly pattern. It predicts strong trend continuation (Usually would be classed as “Capitulation” in indices).

2.20: Very common pullback level. Quite rare the trend is over when 2.20 is hit but very often a pullback. Moves that are going to reverse often do so just before 2.20 if 1.61 is broken. A lot of the time if 2.20 is breached 2.61 will hit at some point, but we can drop all the way back as far as a 1.27 overshoot before this. If a high is made on 2.20 the drop tends to be abrupt and strong. Clean breaks and stalls are possible at this level but it’s always a prime risk for DD on longs and trailing stop area

.
2.61: Big decision level. Can be a spectacular top here. Usually see market flying into the 2.61. A 2.61 reversal is usually a bat pattern. Which means price should fly into it, range at the top for a while and then crash hard to at least 50% retracement of the upswing. The breaking of a 2.61 most often produces a parabolic move. Price goes from appearing to be oversold to being shockingly stronger

.
3.20: I don’t like the 3.xx fibs much. They’re useful in ways but I do not really use them. I find it hard to define strong rules around them. I always trail stops close when we get to these levels. Can produce crashes back to 2.61 in an uptrend.
3.60: Same.
The 3.xx fibs are used in a few harmonics (Including the one we’ll cover next) and probably are useful levels. I just always find myself wondering which one to use and it giving me an area of indecision bigger than I want. So I highly limit decisions made based on just these fibs. I do use them as warnings for exits/pullbacks.

4.23: Extremely high probability level. Something big almost always happens around here. Most of the time it’s a pullback (Beware big stop hunt spike outs of 4.23 first!). I like to say every time a 4.23 does not produce a pullback a fib fairy dies. It’s a rare thing. When it does happen, it usually indicates what will become an incredibly persistent trend. 4.23’s can produce a crash all the way back to spike out 1,27. Often with a 2.61 bounce on the way.

(This is going to be dense harmonic stuff, skip if confusing.
When a 4.23 produces a major reversal this is a deep crab pattern. A crab pattern can also top on either of the 3.xxs and a deep crab 4.23. A crab is like a bat pattern in all ways until the 2.61 breaks. A failed bat evolves into a crab and a failed crab evolves into a deep crab (Look, I didn’t make the rules. Other people put this in books).
This is probably the reason for some 2.61 breaks that produce parabolic moves in. The move represents the final part of the D leg which should be the strongest. And the move goes directly up to one of the fibs above. Lightening quick. And somewhere in that zone, a hard sell usually comes.
So, to summarise that: Any time a bat ABC has formed, price may reverse at 2.61, 3.20, 3.60 or 4.23 and any time you’re wrong betting on any one of those you’re liable to get your throat ripped out if you do not do a great job with your stops. Harmonics are fun … But inside of all the potential moves that can happen here, are many opportunities.
Example of Full Uptrend Leg
Above I’ve given bull/bear considerations and also caveats for practical trading because the market can be rather inconsiderate. Here’s what a bull move usually looks like:
1.27 pullback.
1.61 breaks and retests.
2.20 produces pullback or stall.
2.61 is a major decision level
3s, meh. Something usually happens. Had to know what.
4.23 something highly significant happens. Can crash to 2.61 and 1.27.
These are good norms for a trend move. Be it long term of intraday. Long or short. This is a general roadmap of things I look for in a typical trend move. Day to day I see this in the markets. You can test it various ways, but here’s a really interesting one. Open a weekly chart and go to 2015.
Zoom right in so you can not see any of the action past 2015. Make sure you’re drawing the fib exactly high to low and can not see where the levels project to make sure there’s zero curve fitting
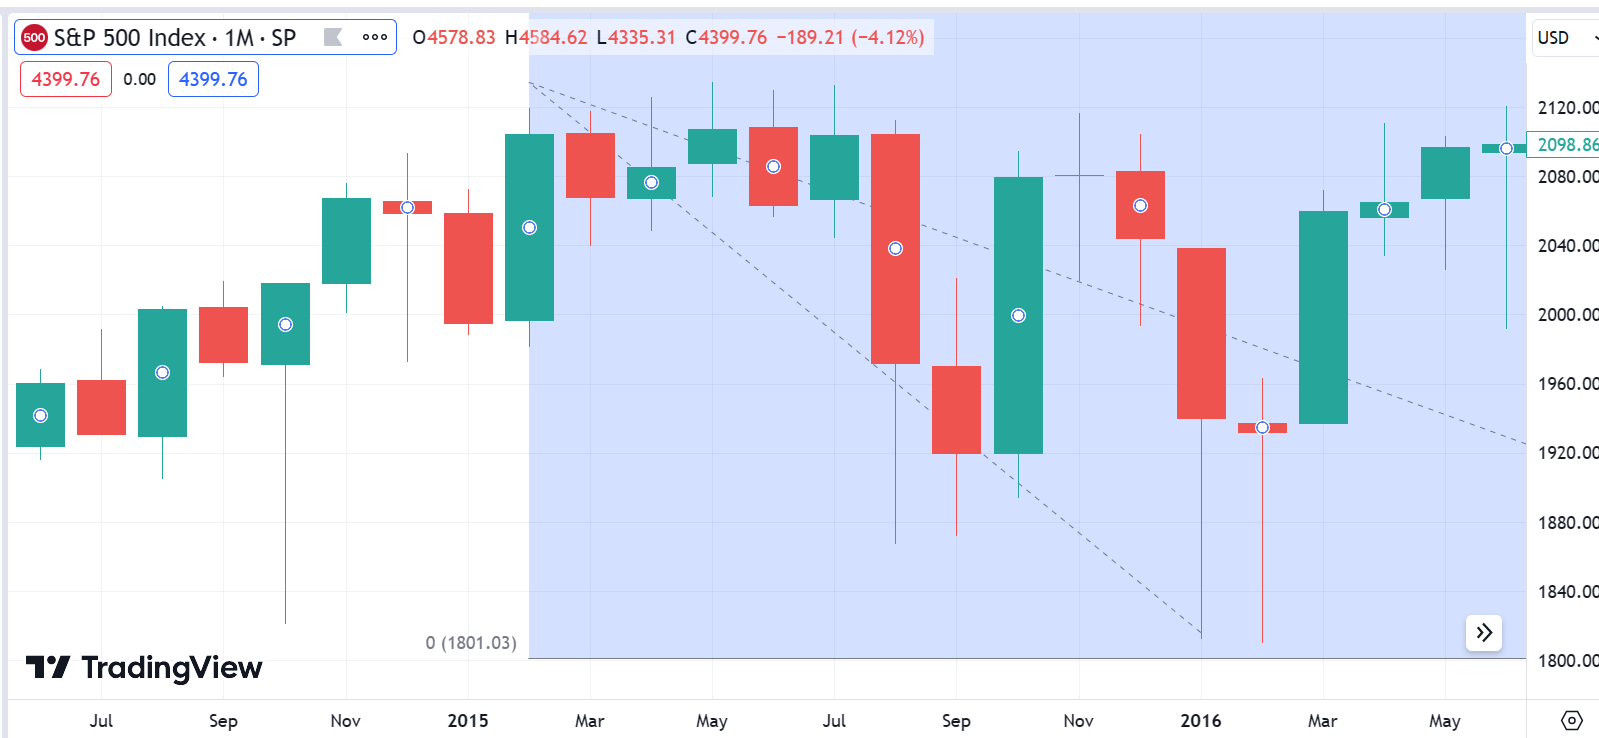
.I’d encourage you to do this before reading on (Where I shown you). So you can see for yourself. Draw the fib and then bar by bar go through the move. You can just zoom out and look at it all if you want, but it’s much more interesting bar by bar where you can think about decisions you may have been able to make based on thinking these fibs matter.
Okay - here’s mine:

I didn’t write the template I just gave you for fibs based on this move. It’s a template I developed before this move. After this move when I went through everything that happened was the first time I noticed this was a 4.23 high - 1.27 low. If I’d known that in 2020 - I’d been much more bullish.
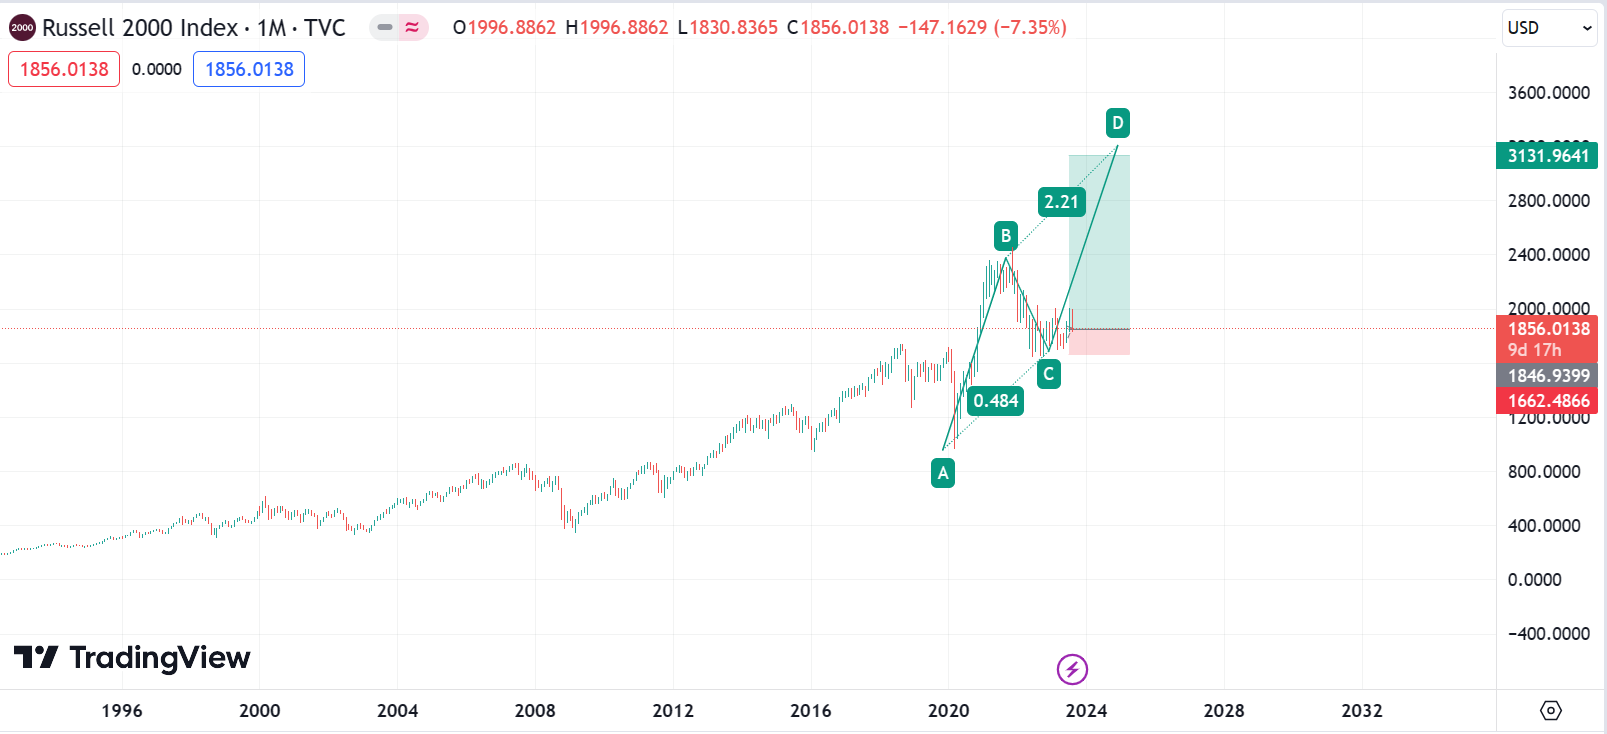
The Projected RUT Trend
Lot of info in the above section. Went through all that partly because it’s stuff that’s been super useful to me over the years and I want to hook you up with something that can be used for all forms of trend trading but also I am just trying to make you see I’m not wildly calling out numbers when I say RUT could double.

RUT doubling would actually be right inside the model of the deep crab.
(SPX version of this was covered in contingency plans)
Saying RUT can double when indices are as extended as they have been over a decade sounds stupid. It sounds like moon-boi nonsense, but there absolutely are known TA patterns that would fully explain the move if RUT went up 100% from where it is today and then absolutely slammed.

(This graphic gives 3.60 as the end point and it is very possible, but never underestimate the power of a big trend to spike 4.23 if it gets this advanced).
This is possible today and there are things that can happen in near future which turn this to likely and then by far most likely. Currently it could be easily annulled - but if RUT rallies all of levels mentioned here come into play and a full run through them could comfortably see 4.23. It would be zero shock to the TA.
The only shock to TA would be if 4.23 hit and prices were not super parabolic mid to late in the move. A crazy hyper extended bull move would not shock the charts.
This would make the RUT about a 7:1 RR trade from current prices uses stops that wold get you out well before anything nasty happened in a bear break.

Back in November I spoke about the possible big AB=CD on SPX and how I didn’t know if it would happen but the entry level for it was incredibly obvious and I explained the various ways buying to position for this pattern would be highly beneficial in the future (Not just the obvious profit of the rally).
That sounded far-fetched and fanciful for SPX in November. Sounded like it would be completely wrong. Now, it’s at very worst half wrong. The levels discussed in that post were the low and a strong rally exactly as described followed it.
And now I’ll show you another one.
Absolutely not saying there’s any guarantee of this, or even RUT going up at all - but there’s an absolutely tremendous trade plan that can be made to be extremely beneficial if RUT plays out even 25% of this move. And in theory, it will be simple. The hardest thing about it would be believing it’s not “Overbought”.
A Possible Jackpot Trade
I have a trade in mind for a stock that hypothetically could do massively well if RUT did this (And it could also flop even if RUT did this). If I say the projected returns it will sound gimmicky and while it most certainly is a speculative trade (And the extremes of the forecast are longshots) I can make a reasonable case for it.
So, I’ll do the case for it (And if this is a thing, this trade has been building up a very long time. My forecast is speculative but it is not whimsical). I’ll run through various different targets from what I’d think fairly conservative to full blown jackpot moves and then we’ll look at hyper RR possibilities.
The trade proposed is risky. I think it’s unlikely you’d lose all your money using anything other than the most aggressive version covered but it would not be less than 50% if it does not work out. This is intended to be a trade with tiny capital risk for potentially a huge pay out.
This is how I think it’s best to look at things like this. The trade has a super low barrier to entry. Can do conservative and aggressive version for under $15. I don’t think it is necessary an “All or nothing” trade, but I’d view it as that and accept the money as “Spent” when putting the position on.
When I’ve spoken with friends on set incomes who ask me about sizing for hyper pay-off / low probability stuff what I usually tell them is decide how many hours of their time they’re willing to spend on the bet. If they are paid $20/hr if they risk $20 then the first hour after they work they can consider the bet worked off.
A nominal amount is lost if it does not work. It’s not emotionally taxing (Although don’t habitually do this or you will just bleed out capital you could have used elsewhere if you don’t have ways to actually hit big trades). They work it off in the first hour, forget about it and maybe later something really nice happens.
Please keep that in mind when reading the analysis for the following op, because I do actually think there’s a good case for this being a profitable trade, possibly highly profitable and an outsider chance of being immensely profitable, but I am talking about this bet in the context of it being one you can comfortably lose.
Keep reading with a 7-day free trial
Subscribe to Market Forecasts and Trade Plans to keep reading this post and get 7 days of free access to the full post archives.