
The Case for a Market Top: SPX 5,000.
The Case for a Market Top: SPX 5,000.

A “Market top” has come to feel like some mythical thing. Something everyone has a story about but we don’t really expect to see ourselves.
There have been so many strong seeming bear cases made and they’ve fail in such spectacular form that the “Cried Wolf” effect is strongly in play and even for those who discard previous signals outside of their methodologies, most methods have flagged up various false bear signals some time in the last years.
Expectation of a top and resolve to bet on a top has weakened over the last year, but the case for a top has not. Some methods of analysis would actually indicate the action we’ve seen strengthens the case for a top. This type of strong run in expected inside the norms of some reversal patterns.
In this piece we’re going to cover the following;
Risks to consider if shorting at highs.
The case for a textbook topping pattern completing around 5,000 on SPX.
How bear signals would be expected to fail and ways to protect against failure.
Risks to consider if shorting at highs.
We started this newsletter in early 2022 with a largely bearish bias and we’ve discussed various types of setups where we can short into rallies since then. During all of this time, we’ve been under all time highs. We’re now at new highs, and this is a very different situation.
When we’re shorting into rallies that are retracements of previous bear legs, we can much easier define our optimal level to bet in and our stop loss on that. We can use simple rules like the 76 retracement strategy and if we’re wrong about an overall bear move we only have to be wrong in a few small zones.
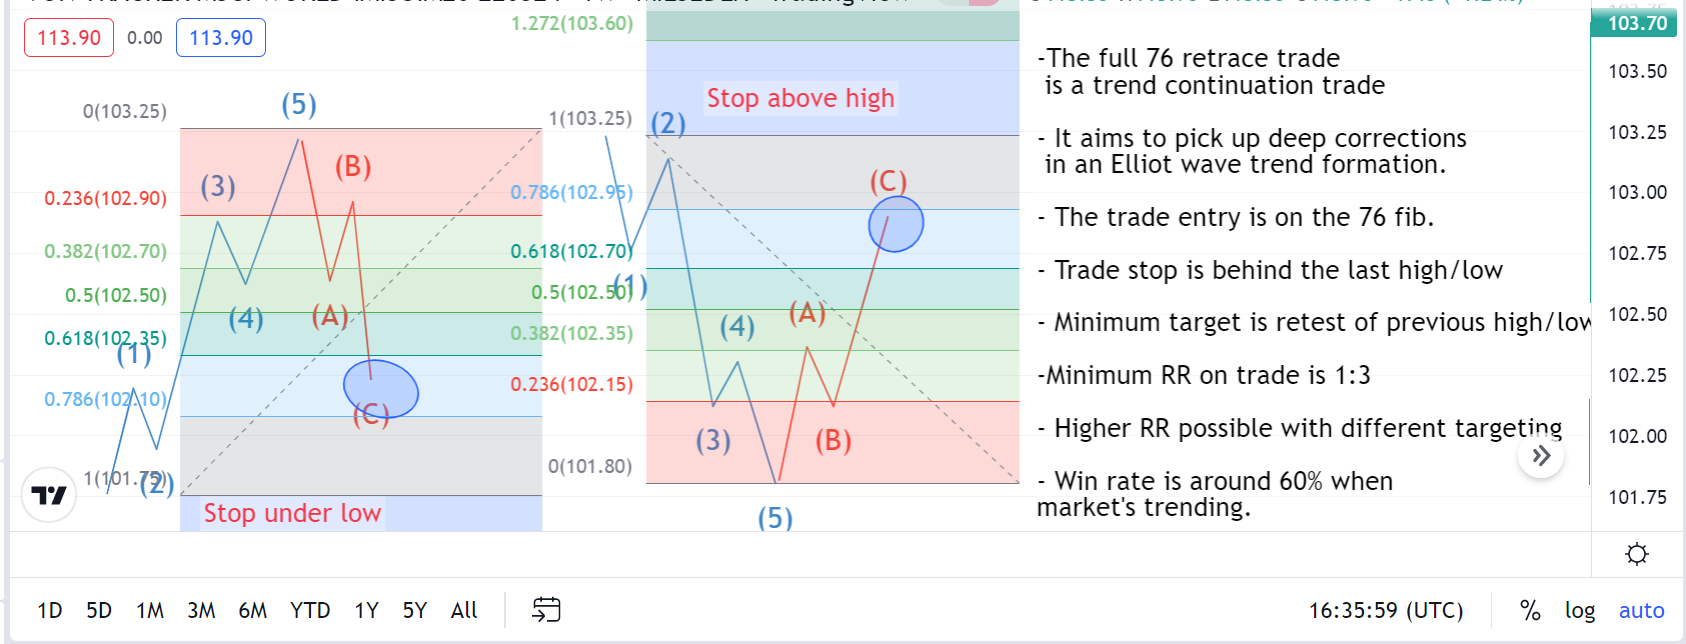
In this type of setup if we’re betting on a new low being made we’re going to always be getting somewhere around 1:5 or better RR. We can justify betting on various levels into scary strong bullish action because we only need 1/5 to work to cover our losses on the times it does not. We might win big and have good odds of breaking even.
Betting on all time highs has sensational RR but it is a lot harder to define tight zones of engagement. And, more critically, it is harder to define exact stop losses. When bear setups fail in SPX they usually do so with strong bull moves. This is okay for bear trades if you can define the stop and use it as a reversal level.
We can define extremely accurate upside levels. This is something fibs have done time and time again in major tops. However, the problem is in most of those examples fibs have done that, there’s been some sort of wick above it. Sometimes little, sometimes huge - but in almost all cases, a final spike happened above the fibs.
This means the optimal strategy for betting changes. Previously when we were using the 76 reversal rules we always wanted to enter around the 76 and always wanting to stop out quickly on an 86 break. In this setup we have tolerance for some head fakes above the 76 but the 76 is a level we’re happy to bet on.
When betting at all time highs I’ve learned whenever you bet at the level exactly dictated by the fibs, it’s a level you’re unhappy you bet on some time later. In fact, the best thing to do is be aware we’re at a big level. Be cautious of getting rugged but expect upside moves to be aggressive.
A trend move ends with a series of aggressive things strongly suggesting the trend must continue. The optimal time to bet on a big top reversal is often at the level it most feels like the pattern is above to fail imminently. With this, we can then again define our tight stop loss zones and be able to realize the high RR ops.
And we have to have some degree of paranoid that something just awe inspiring happens to the bull side first if we’re right. Wicks at the end of trends look like nothing when viewed in the context of the reversal but the real time price action in wicks is often a sight to behold.
We could see SPX trading at 4990 one minute. 5200 the next minute. 4950 the minute after. I’m not saying to bet on this, but these are the sort of extremes that can happen inside of a wick. Many people go long or exit short in a wick. Most people, probably. They don’t all get that wrong at the same time for no reason.
With all that being said, we have now waited until the very midnight hour of the bet pattern. So now we fancy the bet on the huge bat patterns that’s formed over the last years. Let’s get into the case for us being high in what will later become a small wick that looks nothing in context of the chart.
The case for a textbook topping pattern completing around 5,000 on SPX.
In March of 2022 we posted showing how similar the current SPX chart was to the conditions of SPX in 2007. 2007 was not the year of the crash. In 2007 there was a bear move, but it turned into a spike out of the high before the real top.
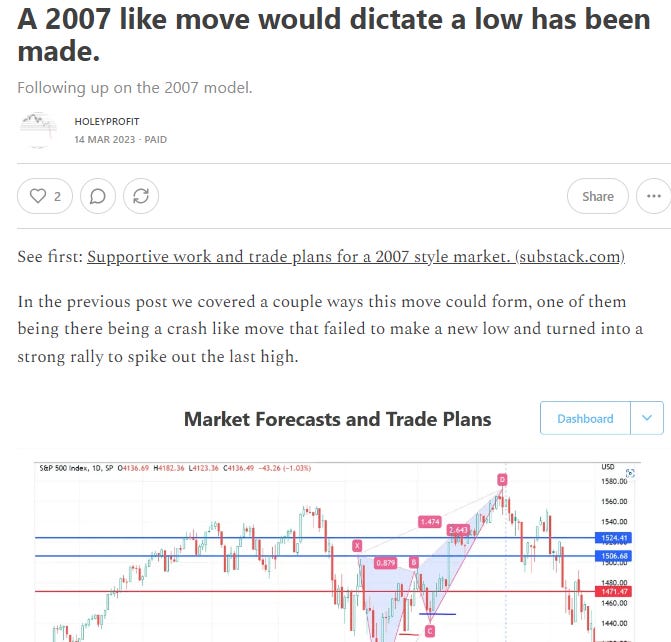
This was a bat pattern and these happen a lot in tops. As someone who trades highs/lows in intraday/week reversals a lot, I run into this frequently. The nice bear signal off the level I like and then the little nominal spike out coming in the most aggressive of ways.
I’ve been through many of these. Had stops ran in many of these. This definitely happens in reversals on small and medium term charts today. And back in 2023 I proposed we might be forming this in the current SPX chart. Which would imply a crash was setting up - but a new high would be made.
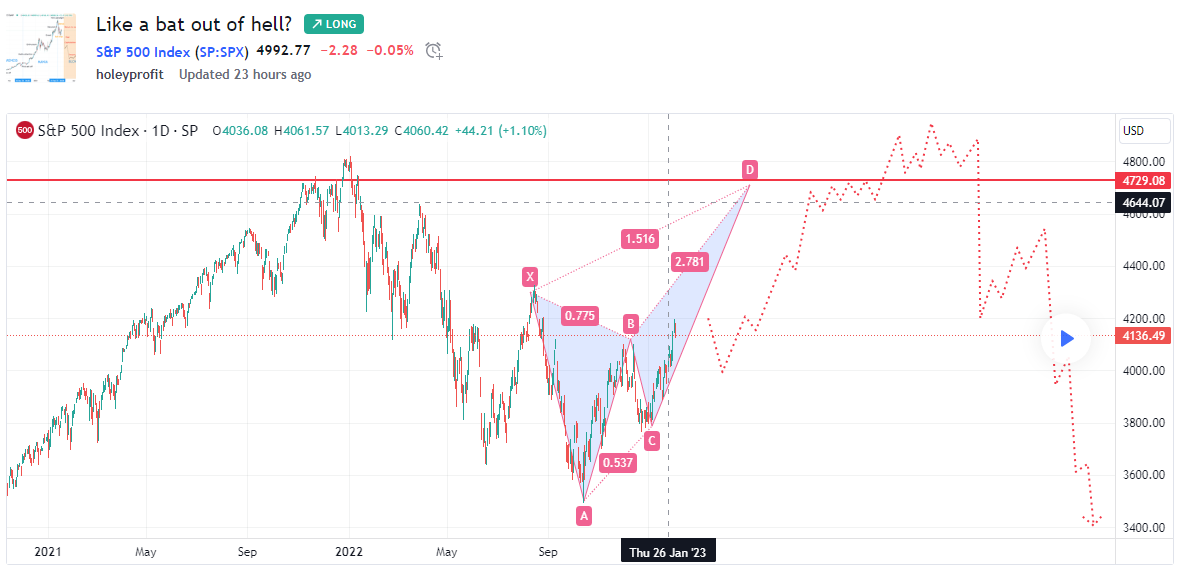
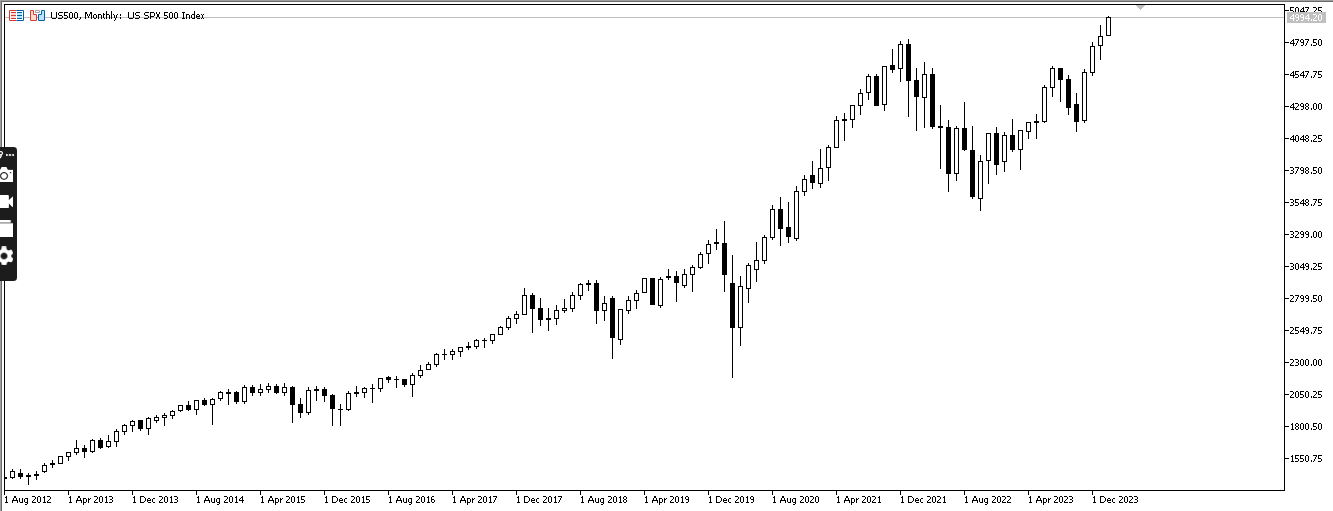
Here’s the price action since then layered over the forecast.
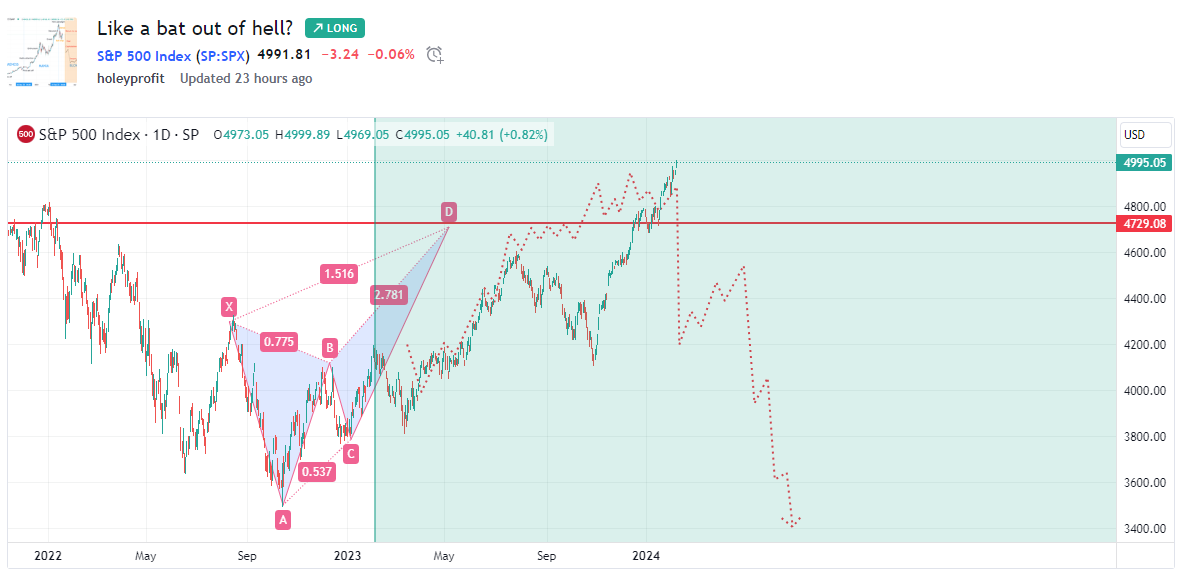
A notable deviation in one section where I have a range with lots of small bear traps and actually a larger drop formed. Other than that, reasonable accurate. We’re now trading just a bit above the point where the forecasted high would be. Quite close to where the forecast pattern would fail.
In a recent post comparing the current Nasdaq chart to previous big spike out highs, we showed how this type of top happened in Bitcoin. That post also said to complete the classic topping pattern norms of a spike out we should see a final move higher sometime in the start of this month.
The requirement given for a bear signal was a spike. Big rejection and the month closing with a wick on top and a bearish body (Big red candle). We have a move higher now. The bat pattern would say we have to be in a false breakout. As we always say, if it’s false breakout that has to be evidenced by a sharp return to the break level.
So for the bat pattern to be in play, it requires the action above the reversal level to be sharply rejected. Another way to say that would be it needs to make a wick with a bearish body. Both of these things tie together really well;
If we’re in a spike out we have to reject hard.
To form a wick we have to reject hard.
At this point betting on this is very speculative (I’d argue the RR makes it viable if done with the intentions of multiple small bets at various levels) but we are getting into very specific things for a sell signal forming. These are not washy things or things we commonly expect to see in every day action.
The bat completed at 4900. What is required is a very obvious strong rejection of any and all trading over 4900 and then a clear holding of this level on a retest (Might be intraday wicks above). When I say a strong rejection this would be best thought of as a crash relative to the action above 4900. It should be a strong, obvious rejection.
The month can not close above the 2.61 (4900). We have to see it a bear bodied candle with the wick above the 2.61. When you look at SPX monthly candles during breakouts, you can see forecasting this to be a bear bodied candle with a wick above would an obvious deviation from the common new high pattern.
It’s often considered far “Safer” to wait for the big bear signal and then short. This way you can at least define your stop loss as being above the wick. There’s a lot to be said for this, but there are some risks that come with that. Let’s now look at false start signals and failure of bear signals entirely.
How bear signals would be expected to fail and ways to protect against failure.
The first easy one to define is a straight failure of the bat signal to produce any downside. We’re basically at that level now. With entries close to 5000 we can use stop around 5070 or so at the widest. If these stop loss levels trade we’ll likely trade at least 5200 and it’d be better to ditch and plan to short higher.
A more problematic failure is when we first have a big sign we’re right and it turns out that is the last big bear trap. That … can be devastating. In that type of setup we’d often spike to about a 1.61 of the big bear candle. Somewhere in the 5200 - 5500 range. Which again would be a tiny move in context of a reversal but strategically significant if looking to short.
This is something we can easily protect against by just been diligent when things look good. Trailing our stops and looking for areas we can take very high RR buys that cost little of our bear profit if wrong but cover our bear butts if we spike to 5200 (Especially if it’s that funky wicky action spoken of above!).
If the market drops hard, no matter how extreme a bearish bias there is at some point it makes sense to buy. At some point, even in the biggest bear move, a big bull trap is likely to form. That bull trap will commonly stop around the 76. Often not before it. If we buy for that move, it also covers us for the false start move (Just trail stops on long).
I say it tentatively because it could really suck to be wrong about a bear move, but I think the case for the completion of the bearish bat and big reversal now is excellent.
The theoretical case is perfect. It’s quite beautiful from the perspective of harmonics and classic topping models. Theory is only good for you when it works. To deal with the risk of it not working you need strategies. Stop loss areas. Understanding of different failure paths of signals.
There are great bearish opportunities here but only if they are well managed using the different strategical aspects covered in this post.
One thing I can say with unwavering confidence, I’d not be long here without a good stop loss.